
Stage 1: Add Reporting Data
Reporting Datasets pull in data from the Reports Manager Module, the Reports Wizard Module and the Online Assessment System Module. The Element Wizard guides you through the procedures required to add Reporting Datasets.
The buttons and screens displayed in the Element Wizard vary slightly according to whether you are running a Cohort Tracking Model (to view results for a group of students) or a Student Tracking Model (to view results for individual students).
To add a Reporting Dataset to your Tracking Model, follow the steps below:
1. Select the Manage Models tab and double click on the Tracking Folder containing the Tracking Model you want to work with.
2. Double click on your selected Tracking Model.
The Run Models screen is displayed for your selected Tracking Model.
3. Either:
Select  from the Add & Create Datasets menu in the Models Sidebar. This takes you straight to Stage 2 of the Element Wizard.
or
Use  and select Add Dataset Element from the drop down list.
or
Click  in the Models Sidebar.
Stage 1 of the Element Wizard is displayed. An example is shown below:

4. Select Reporting Data and click Next to go to Stage 2 of the Element Wizard.
| You can only select one type of Dataset Element at a time, choose to add more types of Dataset Elements later if required. |
Stage 2: Add Reporting Data
Use Stage 2 of the Element Wizard to select the Reporting Datasets you want to include in your Tracking Model.
An example of Stage 2 of the Element Wizard is shown below:
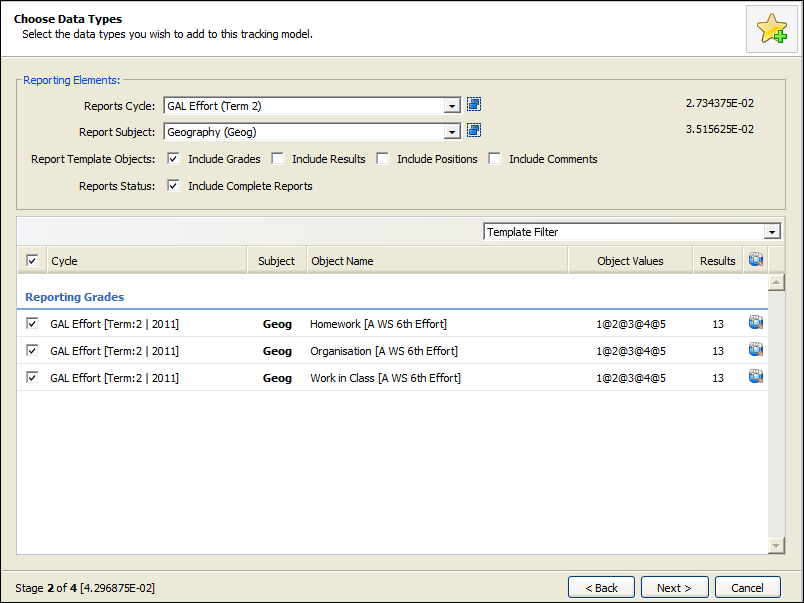
1. Complete the fields in the Reporting Elements section. Your selections influence the list of Reporting Datasets to choose from for your Tracking Model:
Field | Explanation |
Reports Cycle | Select the Reports Cycle that you want to monitor in your Tracking Model. Click Reports Cycle are only displayed if report data is available for the Report Template Objects and Reports Status selected. |
Reports Subject | Select the subject that you want to monitor in your Tracking Model. Click Report Subjects are only displayed if report data is available for the Report Template Objects and Reports Status selected. |
Report Template Objects | Use the check boxes to select the reports that you want to include in your Tracking Model. A message is displayed in the list of Reporting Datasets if your selections are not available. |
Reports Status | Ensure this box is checked to display all the complete Reporting Datasets available. |

2. Use  to select the Reporting Datasets you want to display, if required. This is useful if you have a high volume of data on display.
3. Click  in a Reporting Dataset to view the data it contains, if required.
An example of the View Results window is shown below:

4. Select the Reporting Datasets that you want to include in your Tracking Model. Add Reporting Datasets one at a time if you are running a Student Tracking Model. Adding multiple Reporting Datasets at the same time in a Student Tracking Model creates cells containing multiple values.
Either:
Click  in the View Results window.
or
Use the check boxes on the left of each Reporting Dataset listed in the Element Wizard.
or
Select all of the reports listed by checking the box available in the header row displayed:

5. Select to split reports by teacher, if required. This separates reports by different teachers of the same subject. This option is only available for Cohort Tracking Models.
6. Click Next to display Stage 3 of the Element Wizard.
Stage 3-4: Add Reporting Data
Use Stage 3 of the Element Wizard to adjust the details of the columns displaying Reporting Datasets. Your selections influence the display of Reporting Dataset columns in your Tracking Model. Default settings are in place for your Reporting Datasets columns and adjusting the details is optional.
Choose to skip Stage 3 of the Element Wizard to leave the default settings unchanged when you are running Cohort Tracking Models.
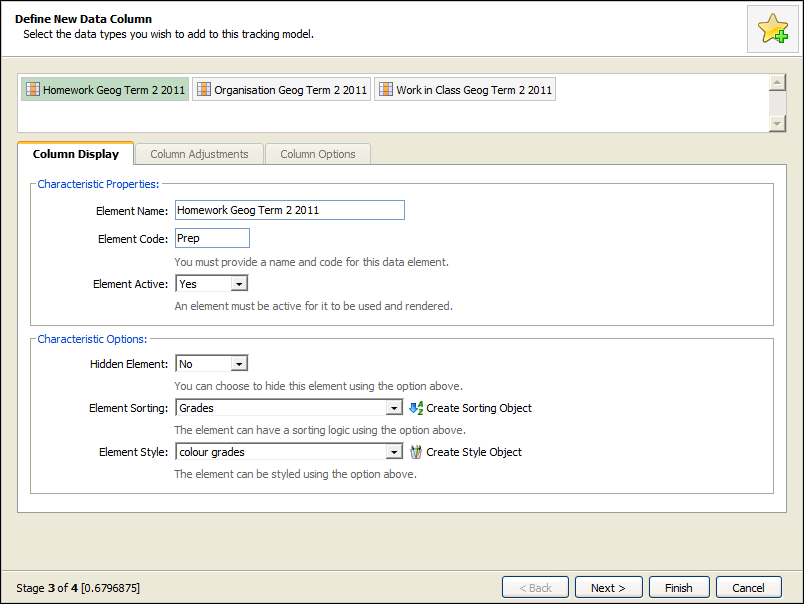
An example of Stage 3 of the Element Wizard is shown below:
1. Either:
For Cohort Tracking Models, click on the name of a Reporting Dataset to adjust the column details.
Each Reporting Dataset you select in Stage 2 of the Element Wizard is displayed in the top of the window. Your selected Reporting Dataset is highlighted green:

or
For Student Tracking Models, select a Grouping Option for the Reporting Dataset:
- Select an existing group option and choose an existing column from your Tracking Model. The Reporting Dataset is listed in the column you select. If the Reporting Dataset refers to a new subject an additional row is created in your Tracking Model. Click Next and Finish to display your Tracking Model.
- Select a new grouping option to create a new column in your Tracking Model. The Reporting Dataset is listed in the column you create. If the Reporting Dataset refers to a new subject an additional row is created in your Tracking Model.
2. Select the Column Display tab and alter the sections displayed, if required:
Section | Explanation |
Characteristic Properties | Element Name. Change the name used to describe the Reporting Dataset column. Ensure that it is still easily identifiable. Element Code. Change the code used to identify the Reporting Dataset column. Use a more concise term if required, this is displayed in your Tracking Model. Element Active. Select Yes to start using the Reporting Dataset column. Active Reporting Dataset columns are identified by the icon in the Manage Dataset Elements window. Selecting No makes the Reporting Dataset column inactive and you are unable to use it. |
Characteristic Options | Hidden Element. Choose to hide the Reporting Dataset column if you do not want it to display in your Tracking Model. Your selection influences the display of the Reporting Dataset column only. The data in a hidden Reporting Dataset column is still active. Visible Reporting Datasets columns are identified by the icon in the Manage Dataset Elements window. Element Sorting. Select an appropriate method of sorting the results displayed in the Reporting Dataset column. For example, for numerical effort grades choose to sort by number. Use Use |

3. Select the Column Adjustments tab and alter the sections displayed, if required:
Section | Explanation |
Column Adjustments | Select either: Gradeset Column. Select to apply a Gradeset Object, where appropriate, to translate varying numerical values into easily identifiable grades. For example, translate percentage score exam results into grades A-E. Use this to display common values in the columns of your Tracking Model, making it easier to read 'at-a-glance'. Use or Transpose Column. Select to apply a Transpose Object, where appropriate, to change the format of the values displayed. For example, transpose numerical effort grades into grades A-E. Use this to display common values in the columns of your Tracking Model, making it easier to read 'at-a-glance'. Use |
Column Format | Select the type of data you are displaying, for example text data or numerical data. Adjust the decimal places, if applicable. |
Column Values | Add a Column Prefix or Column Suffix, where appropriate. For example, use this to display '%' in percentage score exam results to clarify the data displayed in your Tracking Model. |
4. Select the Column Options tab. Use the check boxes to display statistics for the Reporting Dataset column in your Tracking Model. This provides useful 'at-a-glance' statistics.
5. Continue to work through all the Reporting Datasets you have selected for your Tracking Model. Click on the name of each Reporting Dataset at the top of the window. Work through the tabs available to adjust the details, where required.
6. Click Next once you have completed the adjustments for all your Reporting Datasets. A window is displayed prompting you that the Element Wizard is complete.
7. Click Finish to display your Tracking Model.
8. Click  .
.
Your Reporting Datasets are listed in the columns of your Tracking Model. An example is shown below:

You are now ready to add more Dataset Elements, as required.